Notifiarr Client Health Checks
This is one of the most powerful features we provide. And it's free. You can configure an unlimited number of service checks in the Notifiarr Client. These checks can check URLs for specific response codes, look for running processes, check TCP ports, or ping hosts.
Enable Network Integration
- This client feature sends reports to the website using the Network Integration.
- Make sure you enable that Integration on the website and choose a chat channel for notifications.
This page explains the logic the service check module uses.
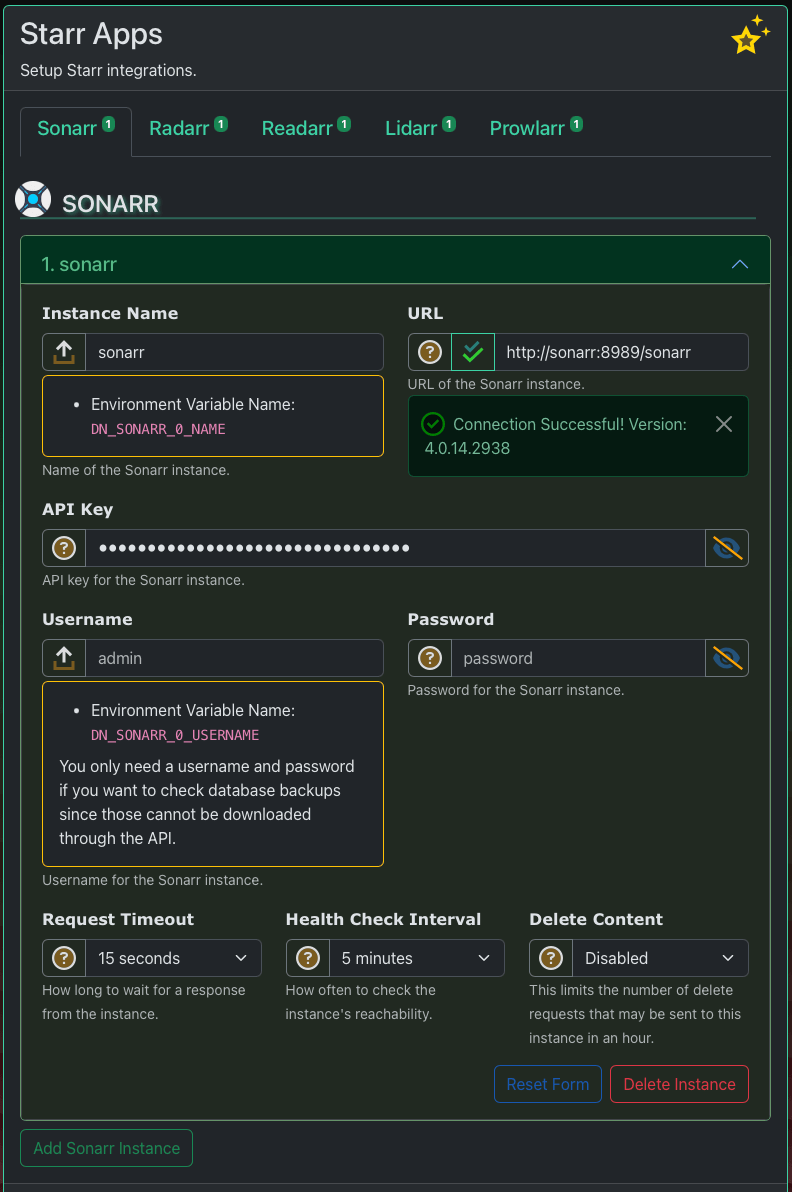
Automatic Instance Checks
The application will automatically add service checks for any instances you configure. An instance is just an application like Radarr or Transmission. When you add the instance, all you need to do is choose a Check Interval duration. That determines how often the client checks the instance's health.
Assumptions
Some of the automatic service checks may set the HTTP expect code to something other than 200 / OK. This is normal. There are few configurations for the automatic service checks, most settings are hard coded assumptions. The test buttons in the Web UI use different logic than the automatic service checks.
The automatic service checks do not work in every environment. You should disable them, and create custom checks if they are not working for you.
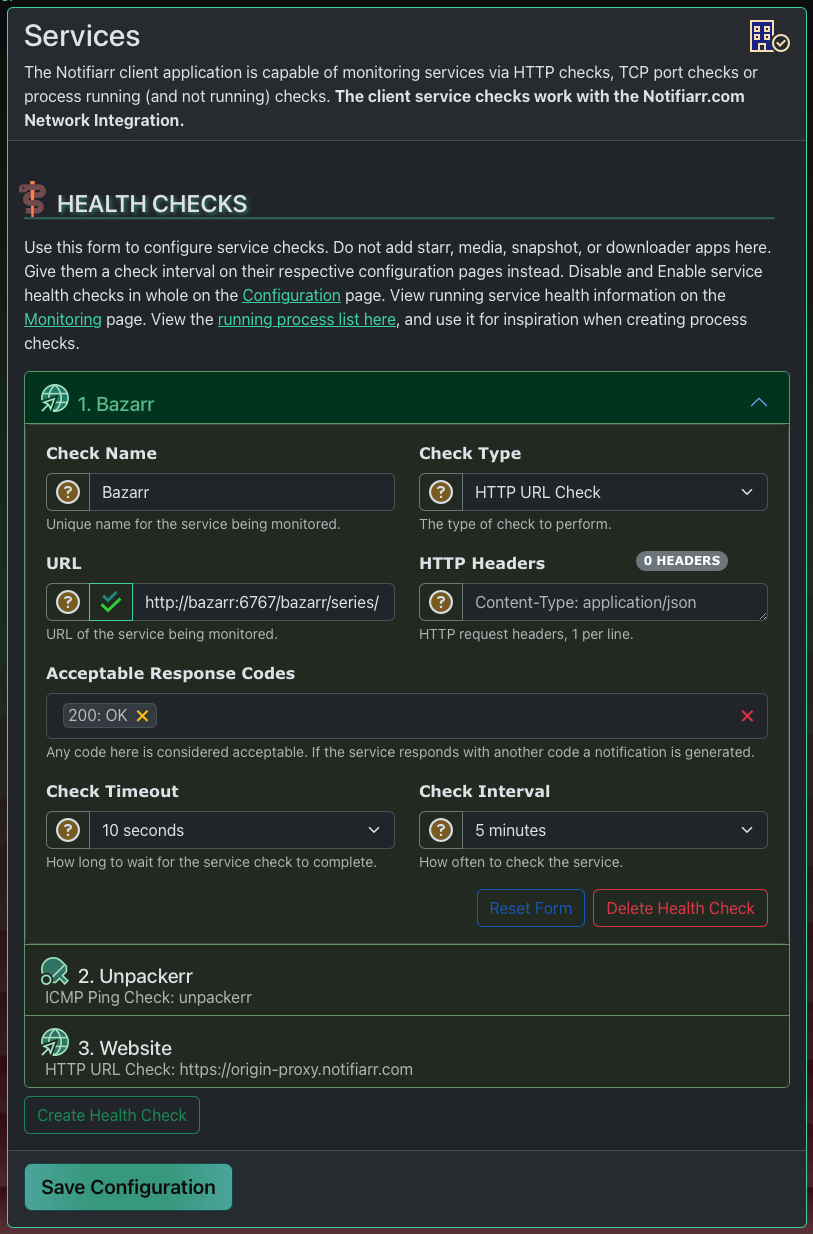
Custom Health Checks
Five check types are supported:
- HTTP URL Check - Monitor a URL for reachability. Configure expected response codes, custom request headers, and SSL certificate validation.
- TCP Port Reachability - Monitor a TCP port for connectivity using the
host:portformat. - Process Check - Monitor that a process is running (or not running). Can check process count (minimum and maximum), and detect restarts by monitoring PID changes.
- ICMP Ping Check - Ping a host or IP using ICMP. Requires giving the notifiarr binary capabilities on Linux:
sudo setcap cap_net_raw=+ep /usr/bin/notifiarr. In Docker, enable privileged mode or set the capability. - UDP Ping Check - Ping a host or IP using UDP. On Linux, enable with:
sudo sysctl -w net.ipv4.ping_group_range="0 2147483647". Not available on Windows.
Both ping check types allow configuring the packet count, minimum required replies, and the interval between packets.
Configure custom checks in the Web UI on the Settings => Services page. Each check requires a unique name, a check type, and a check interval. The Web UI does a good job of documenting the service check configuration, so this section is light on words. Go check out the Web UI for information about how to configure a service check.
Process Check Help
Use the --ps command-line flag to print the system process list. This is helpful when creating process checks so you can see the exact process names available. In the Web UI, the running process list is linked from the Services page header.
Global Controls
- Enable/Disable - All health checks can be globally enabled or disabled from the Services page header using the
Health Checksdropdown, or with theDN_SERVICES_DISABLEDenvironment variable. - Services Log File - Health check results can be written to a dedicated log file. Configure this on the Settings => Configuration page under Logging, or with the
DN_SERVICES_LOG_FILEenvironment variable.
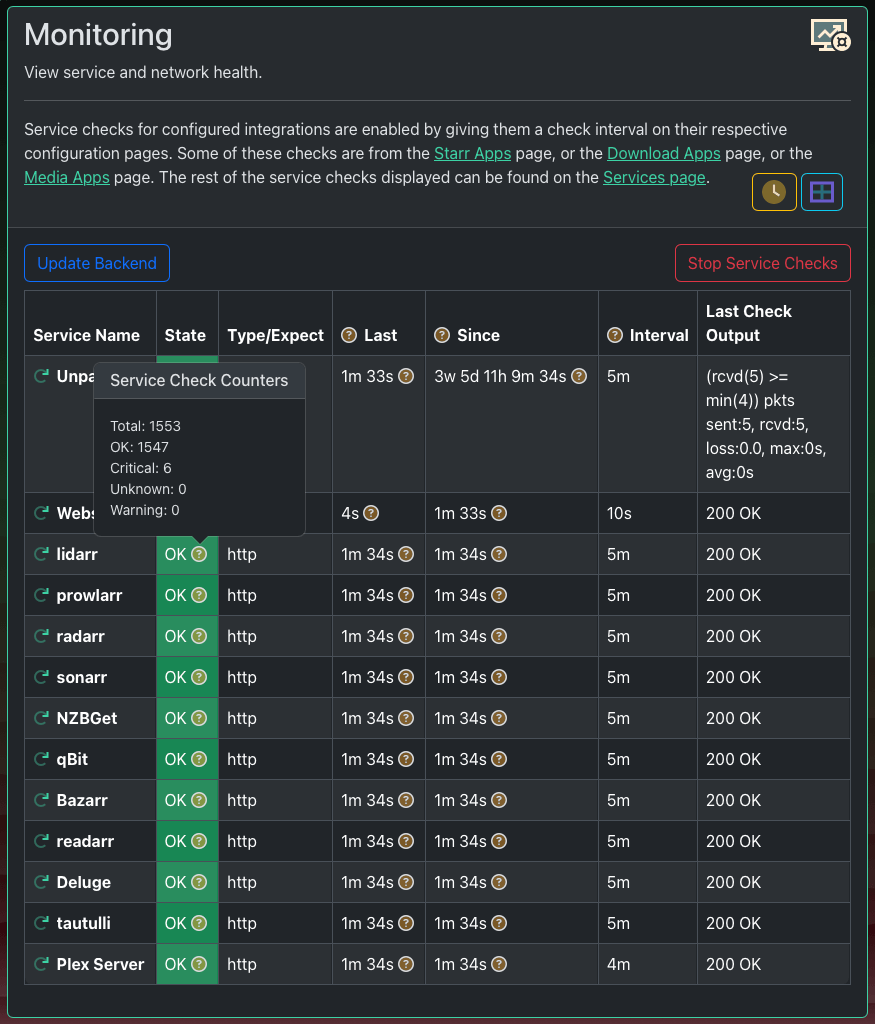
Monitoring
- Find current statuses on the Insights => Monitoring page in the client Web UI.
- Configure a custom Service Status Page on the website in the Network Integration.
Website Configuration
Configure the notifications chat channel, which role gets pinged, and a few other notification settings in the Network Integration on the website.
When a service changes state the new state is immediately reported to the website. By default the website will turn this state change into an immediate notification. The notification goes to the Network Integration channel that has been selected.
The Monitoring page offers two view modes: a classic table view and a card view. You can toggle between them using the button in the page header. An auto-refresh interval can be configured to periodically update the displayed results. Health checks can be paused and resumed directly from this page.